
The Cost of Inaction
Designing a data-driven narrative for the Agentic Marketing era
Time
April 2026
Role
Lead Product & Web Designer
Contributions
Defined the narrative framework and content structure for a data-driven report
Translated complex insights into clear visual storytelling
Developed a visual identity to unify data, narrative, and campaign touchpoints
Designed scalable data visualization system
Led end-to-end experience across report and landing page
Deliverable
Research report PDF
Conversion-focused landing page
Data visualization and visual storytelling system
Campaign assets across web, email, and social
Overview
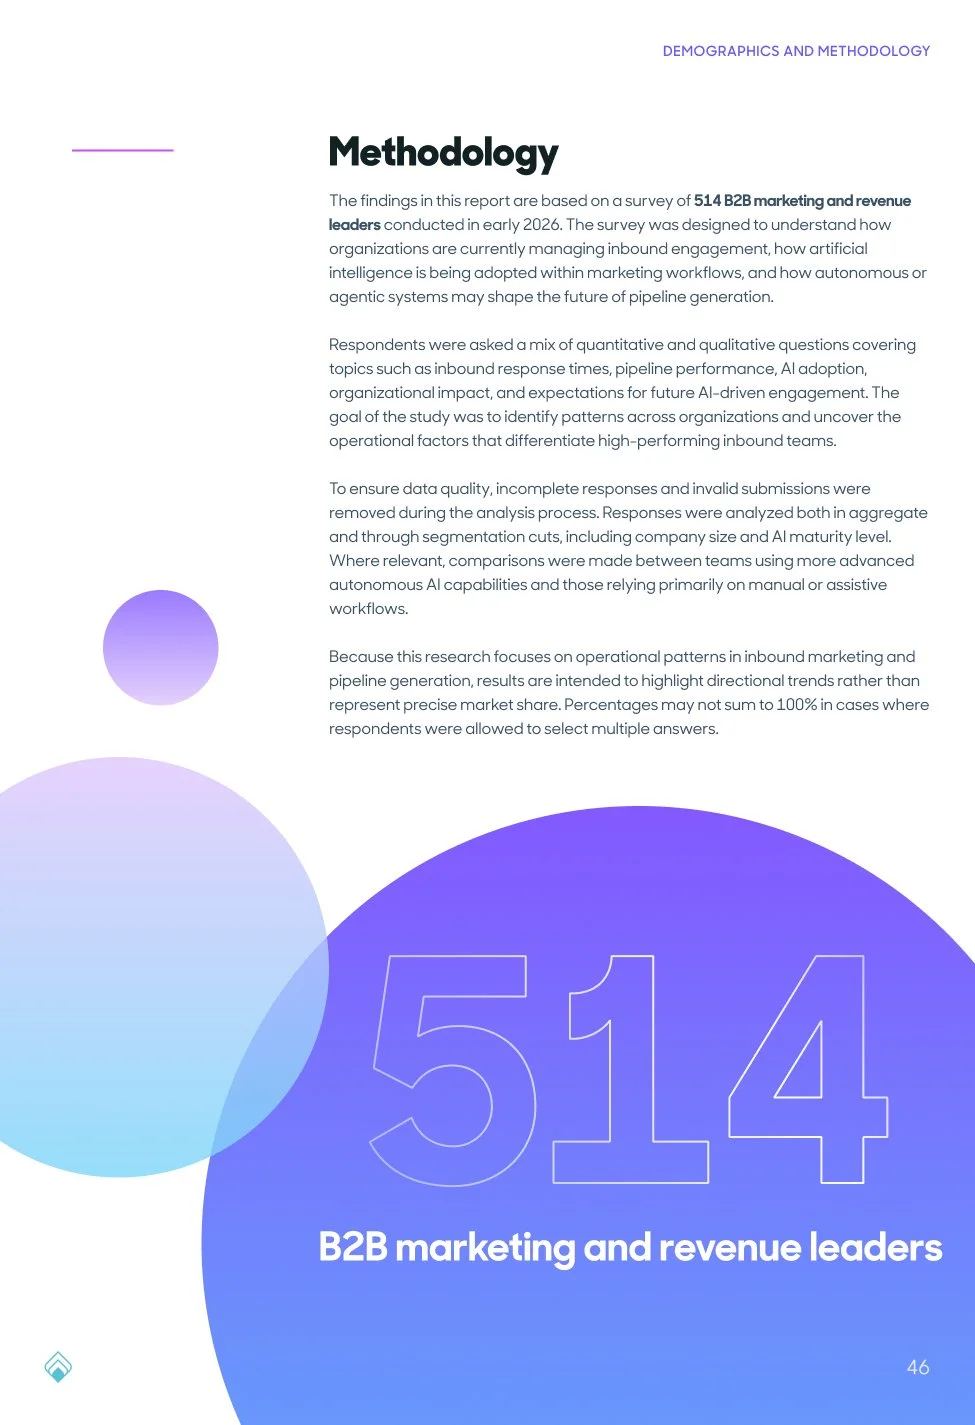
In 2026, we set out to understand how marketing teams are adapting to the shift toward agentic marketing—and more importantly, what it costs when they don’t.
Working with survey data from 500+ marketing leaders, I led the design of a research report and landing experience that translates complex findings into a compelling, data-driven narrative.
The goal wasn’t just to present data, but to create a persuasive story that helps marketing leaders recognize gaps in their funnel and take action.
👀 Challenge
The core challenge was not the data itself—but how to make it meaningful.
We were working with raw survey insights that were complex, fragmented, and difficult to interpret. At the same time, the audience—CMOs and marketing leaders—needed clear, actionable takeaways, not just statistics.
The challenge became:
How might we turn abstract data into a clear, persuasive narrative?
How do we communicate urgency without overwhelming the audience?
How can a report function not just as content, but as a conversion tool?
✍️ Design Approach
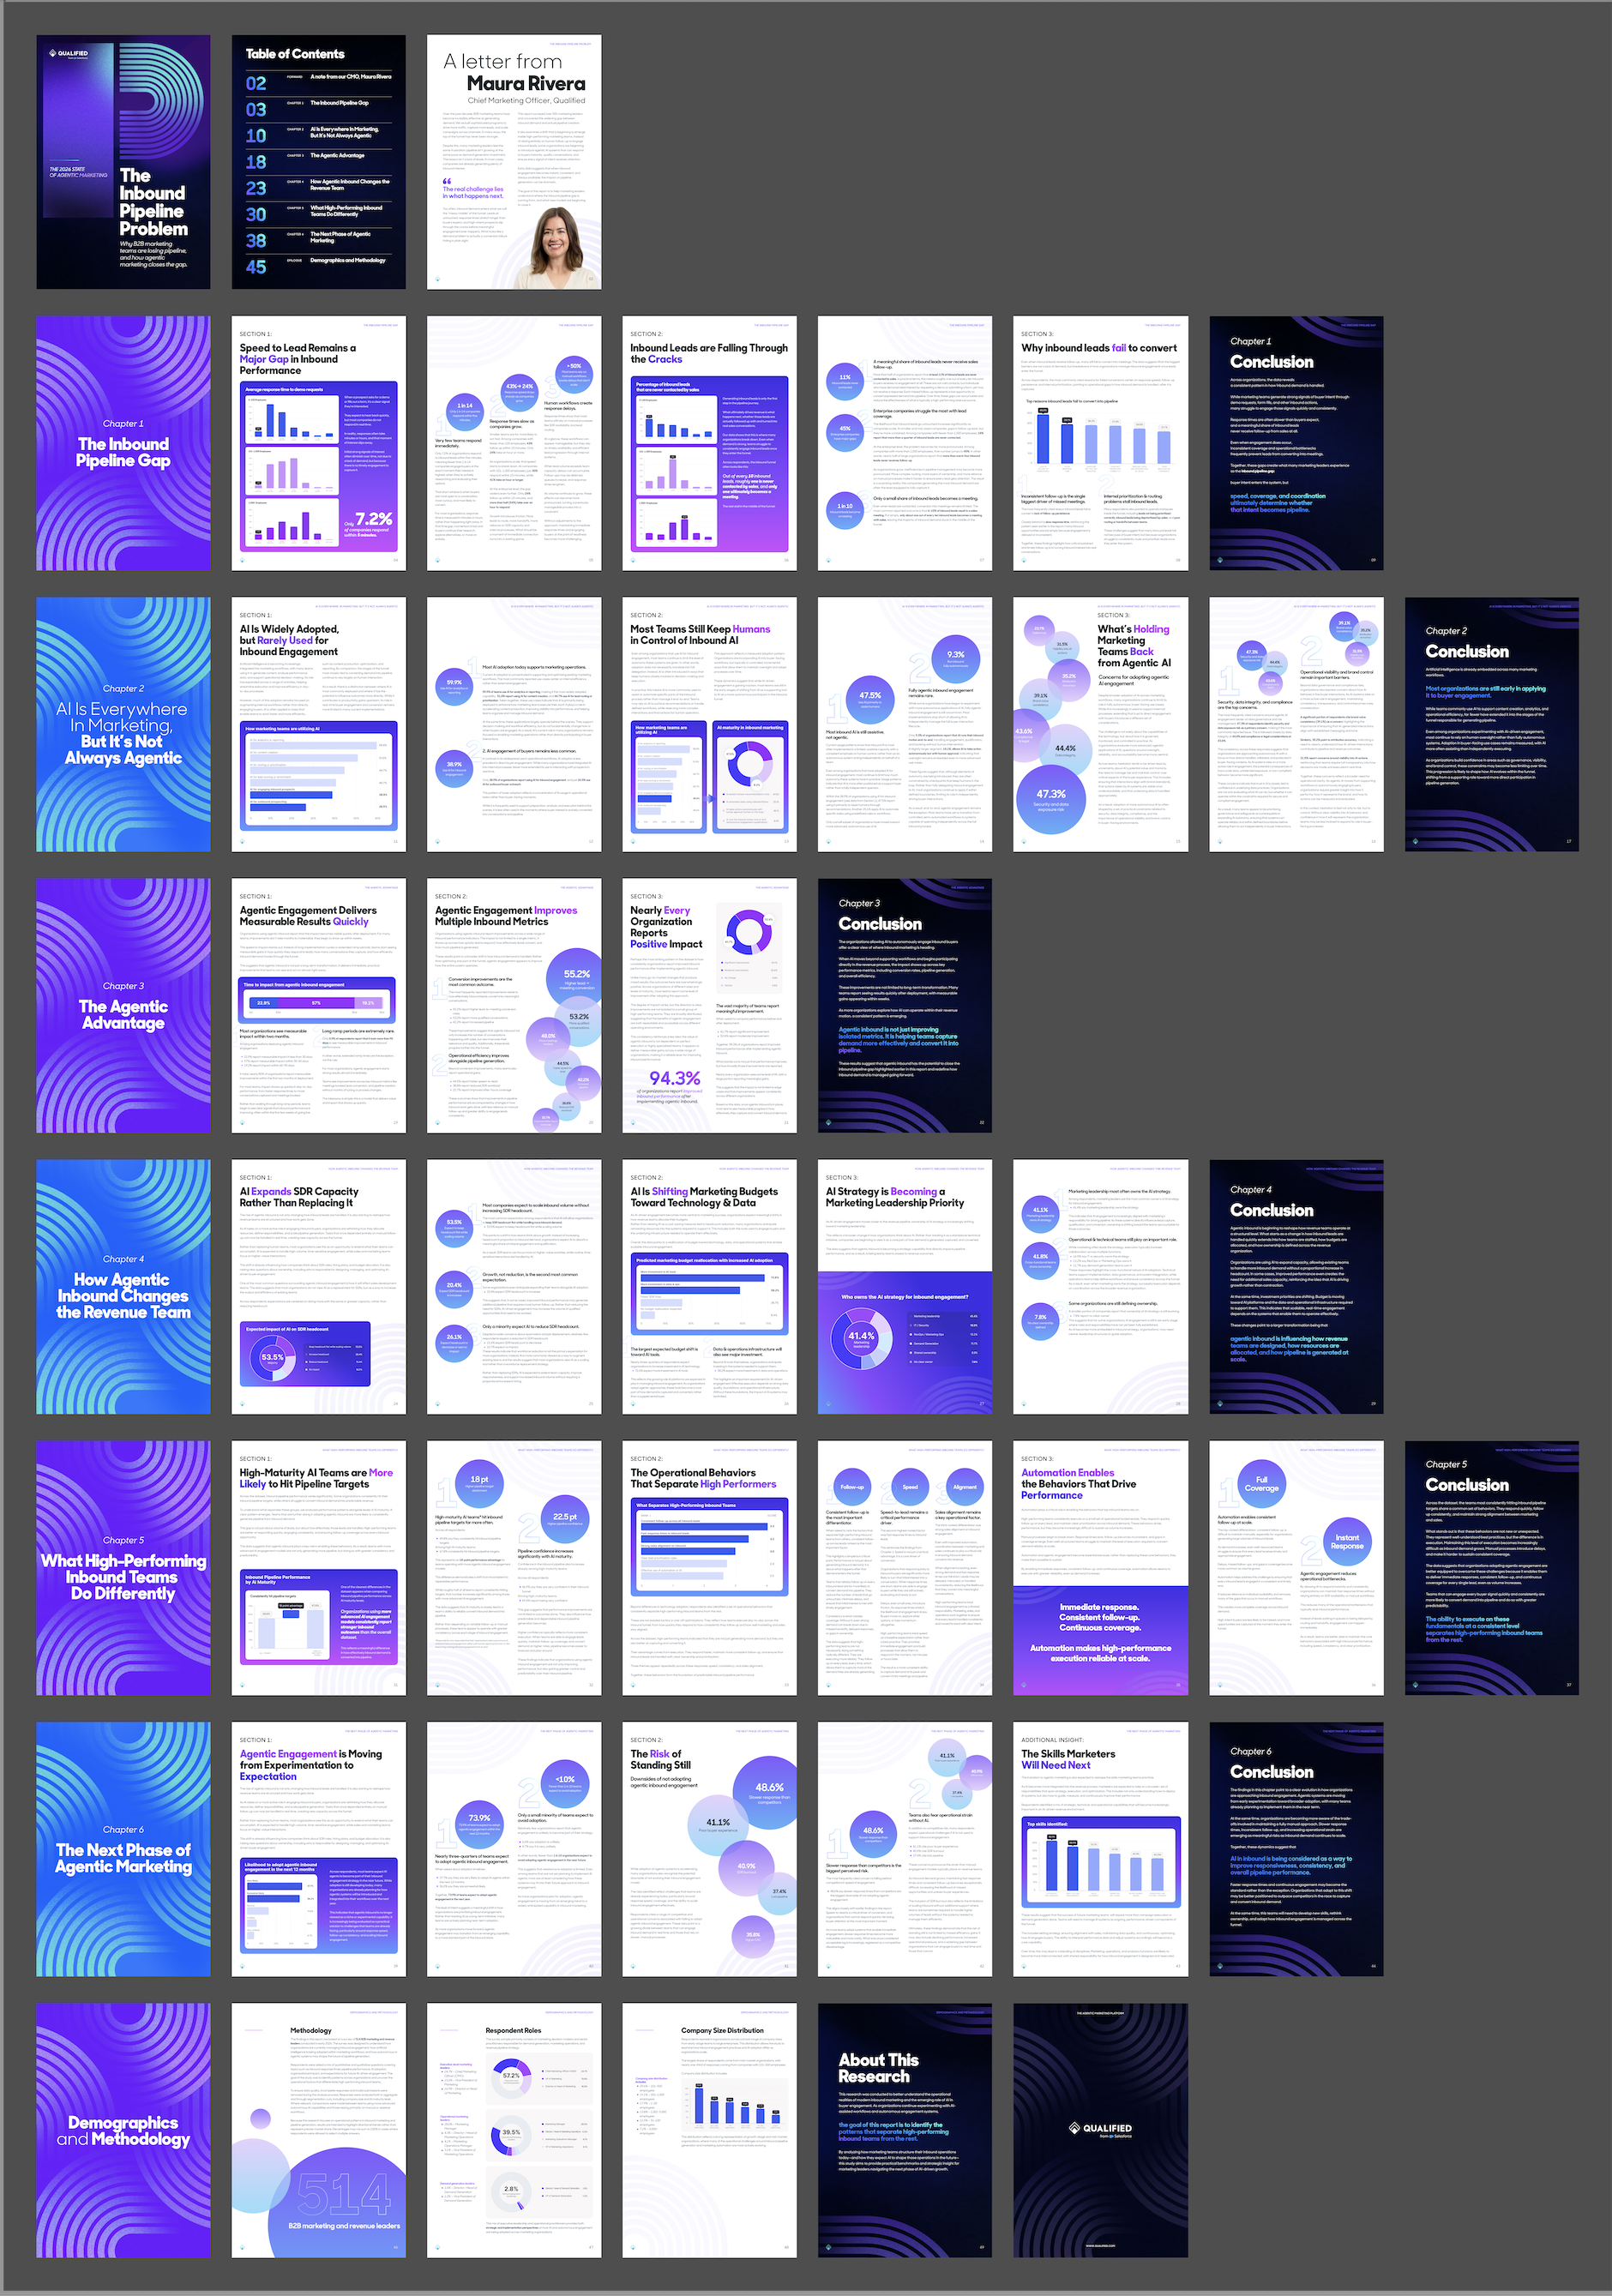
I approached this project as a narrative design problem rather than a traditional report.
Working with insights defined by the PMM team, I focused on shaping how the story is experienced—translating complex findings into a clear and compelling narrative flow.
Instead of structuring the report as static sections, I designed a story arc to guide readers through the content:
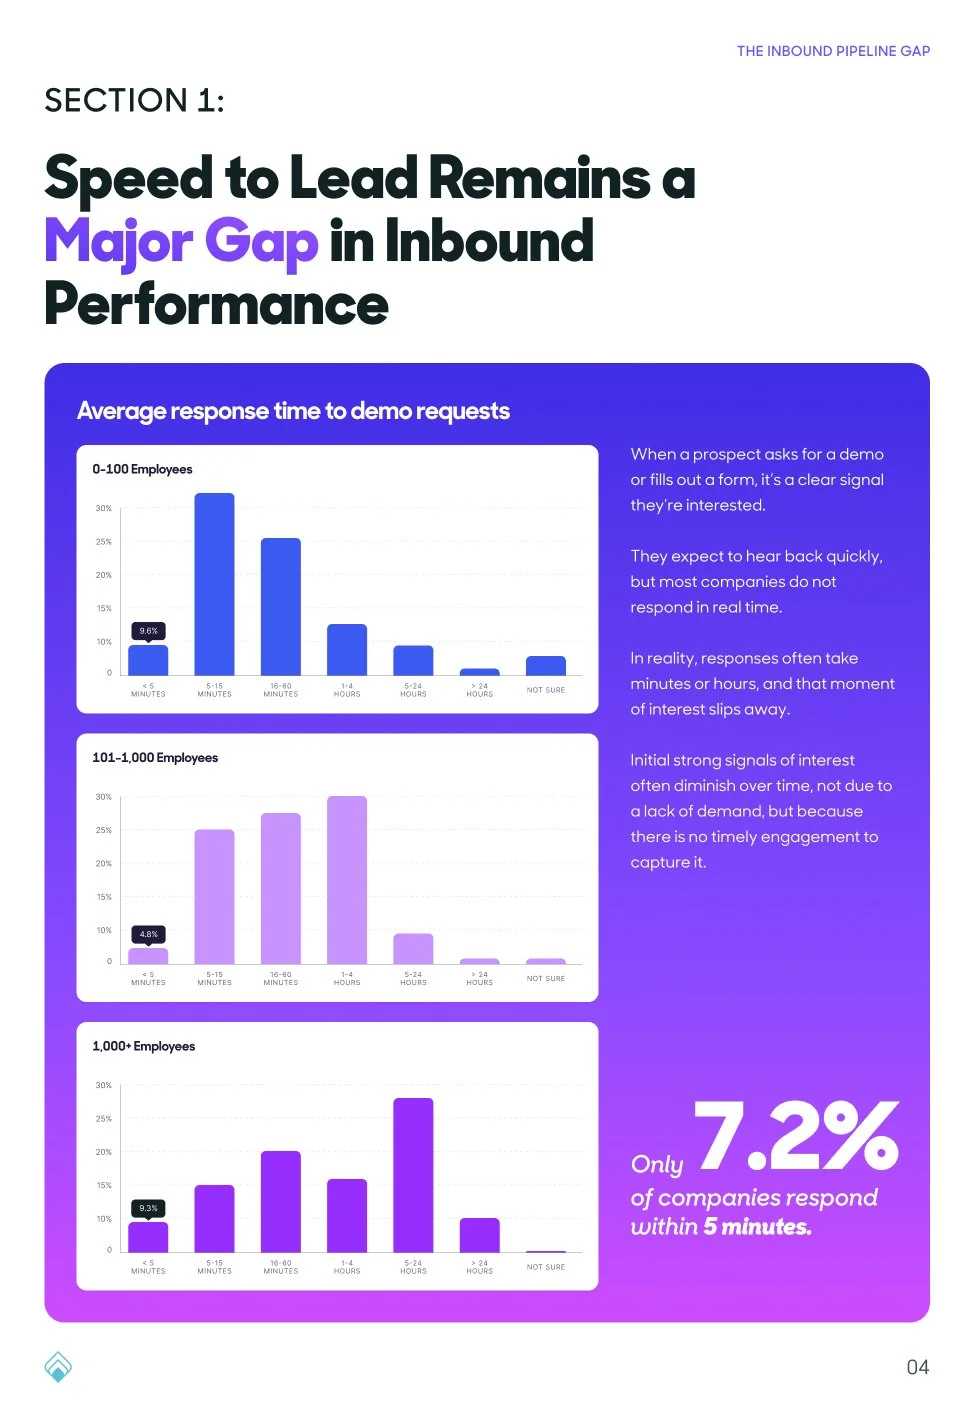
Framing the problem
→ Highlighting the gap between demand generation and follow-upVisualizing the impact
→ Using data visualizations to surface inefficiencies and missed opportunitiesIntroducing a shift
→ Positioning agentic marketing as a new operating modelReinforcing outcomes
→ Emphasizing improvements in pipeline, speed, and engagement
This approach transforms the report from a collection of insights into a guided narrative—helping readers move from awareness to understanding, and ultimately toward action.
🎯 Information Architecture
To make the report scannable and impactful, I restructured the content into a layered information hierarchy:
Headline insights first to capture attention
Supporting data visualizations to build credibility
Contextual explanations to guide interpretation
Clear transitions to maintain narrative flow
The goal was to allow both quick scanning and deep reading—supporting different user behaviors without losing clarity.
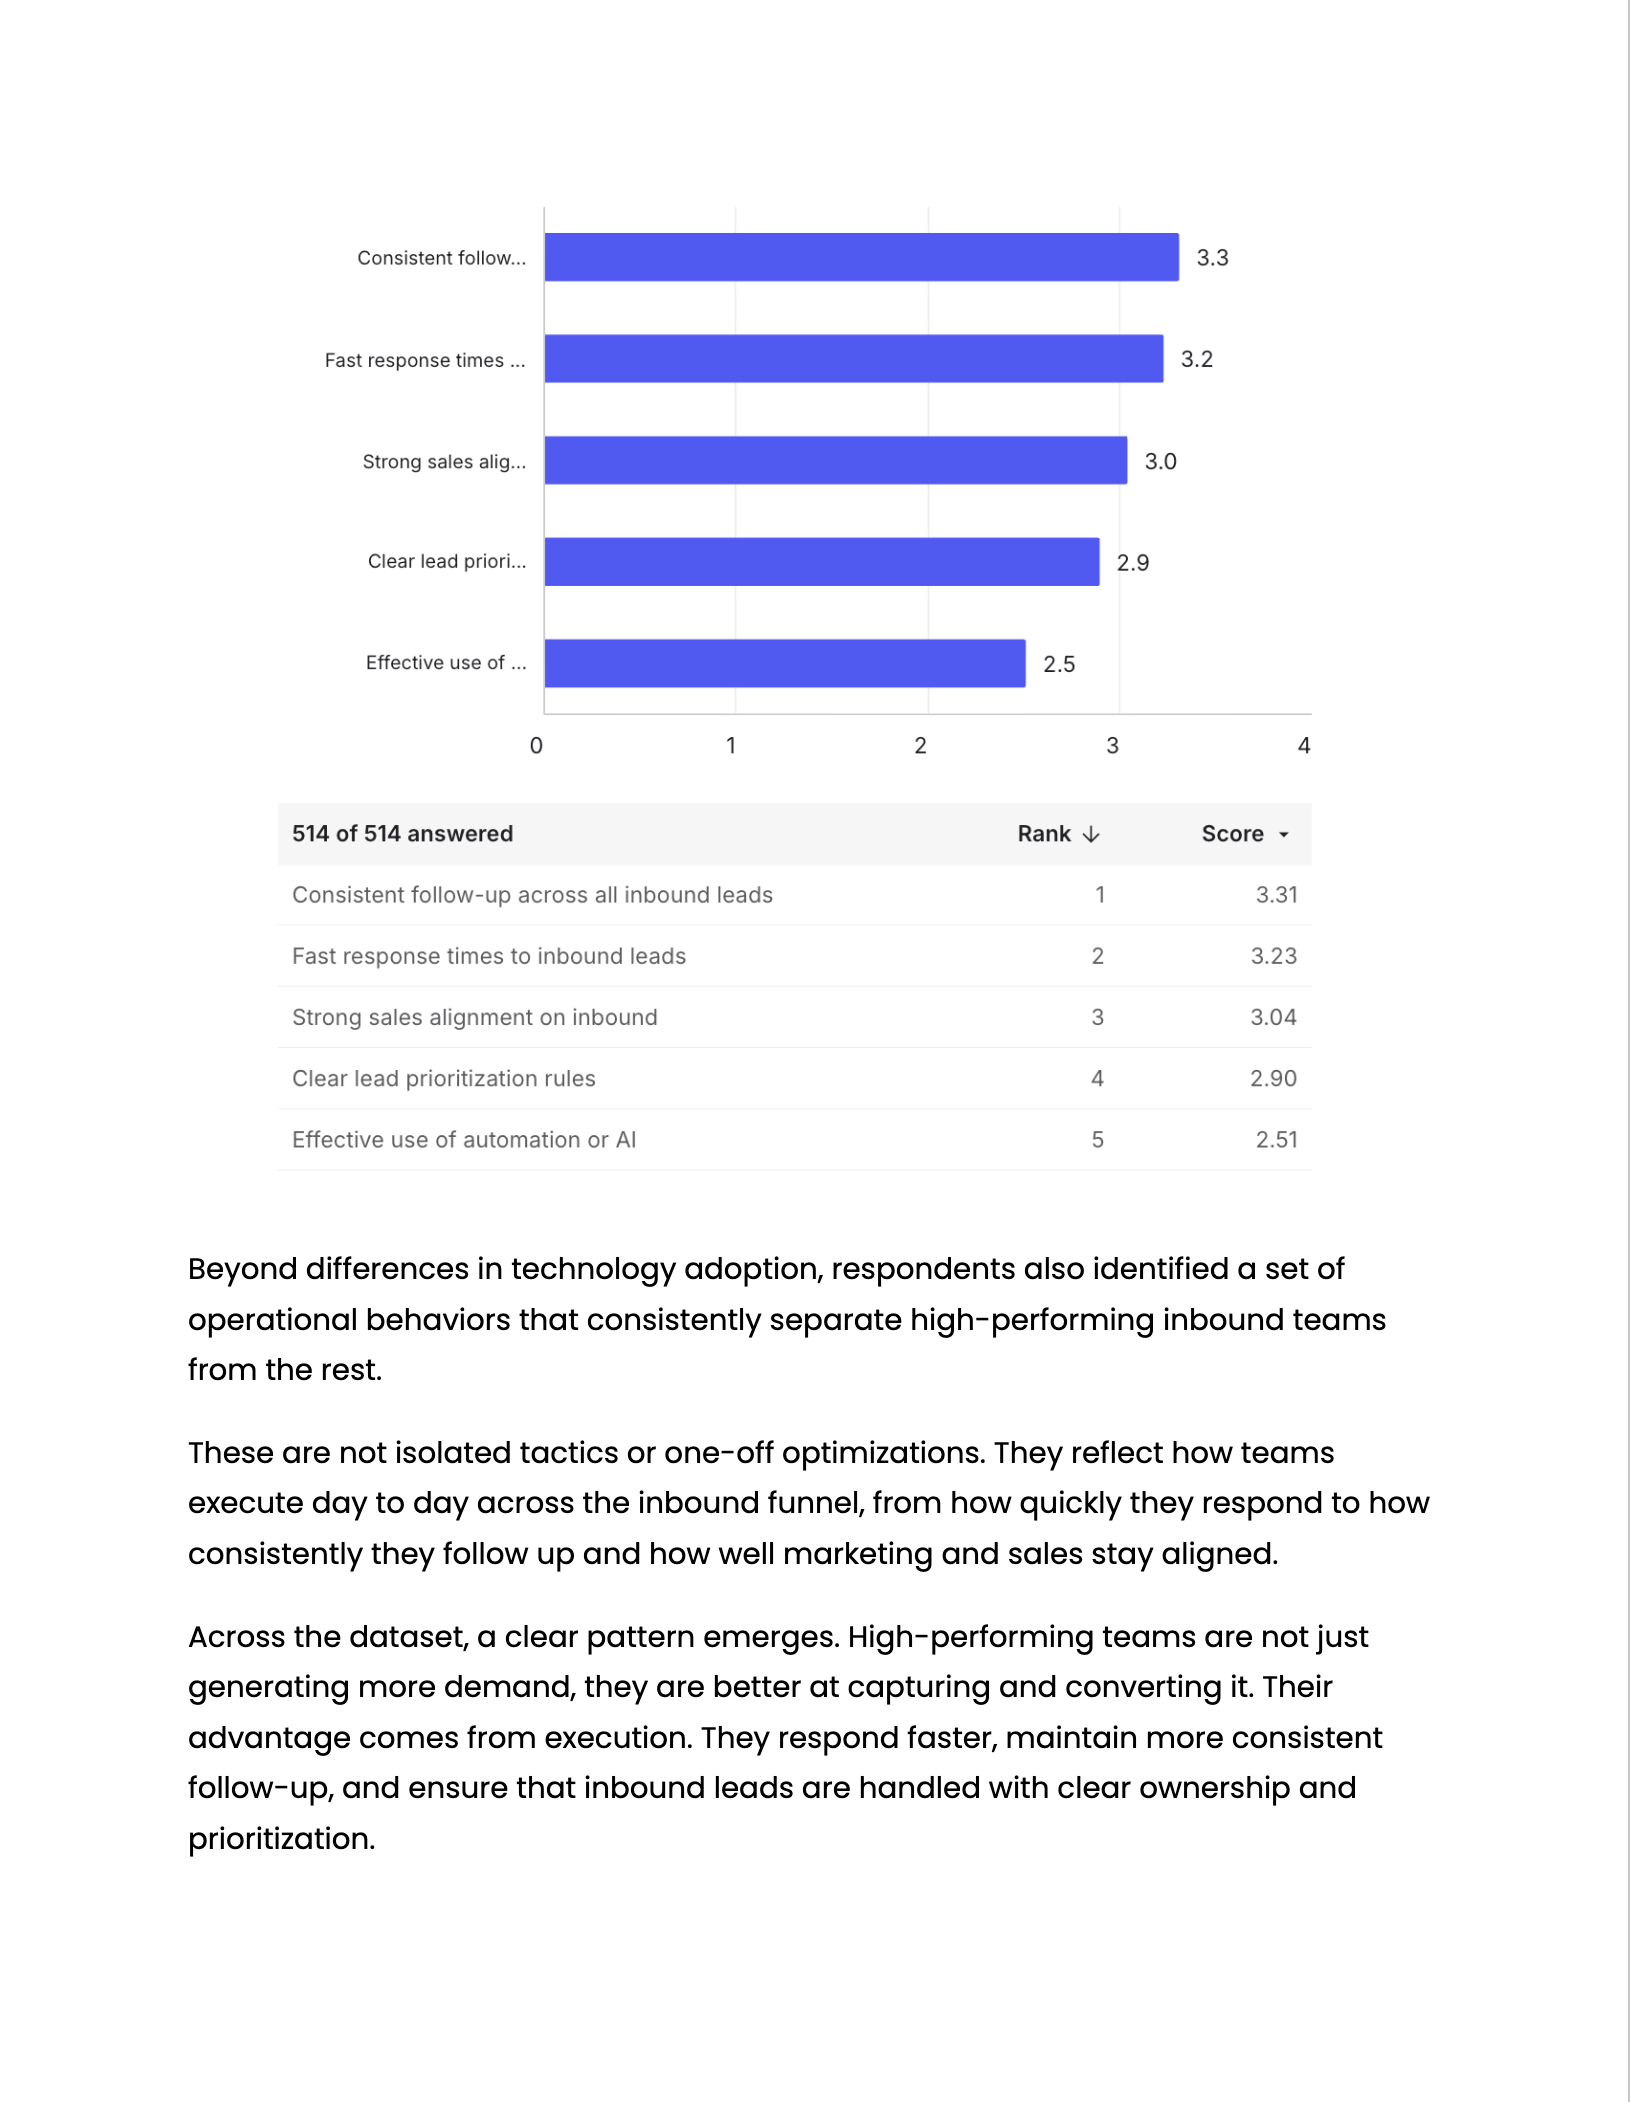
Data Visualization
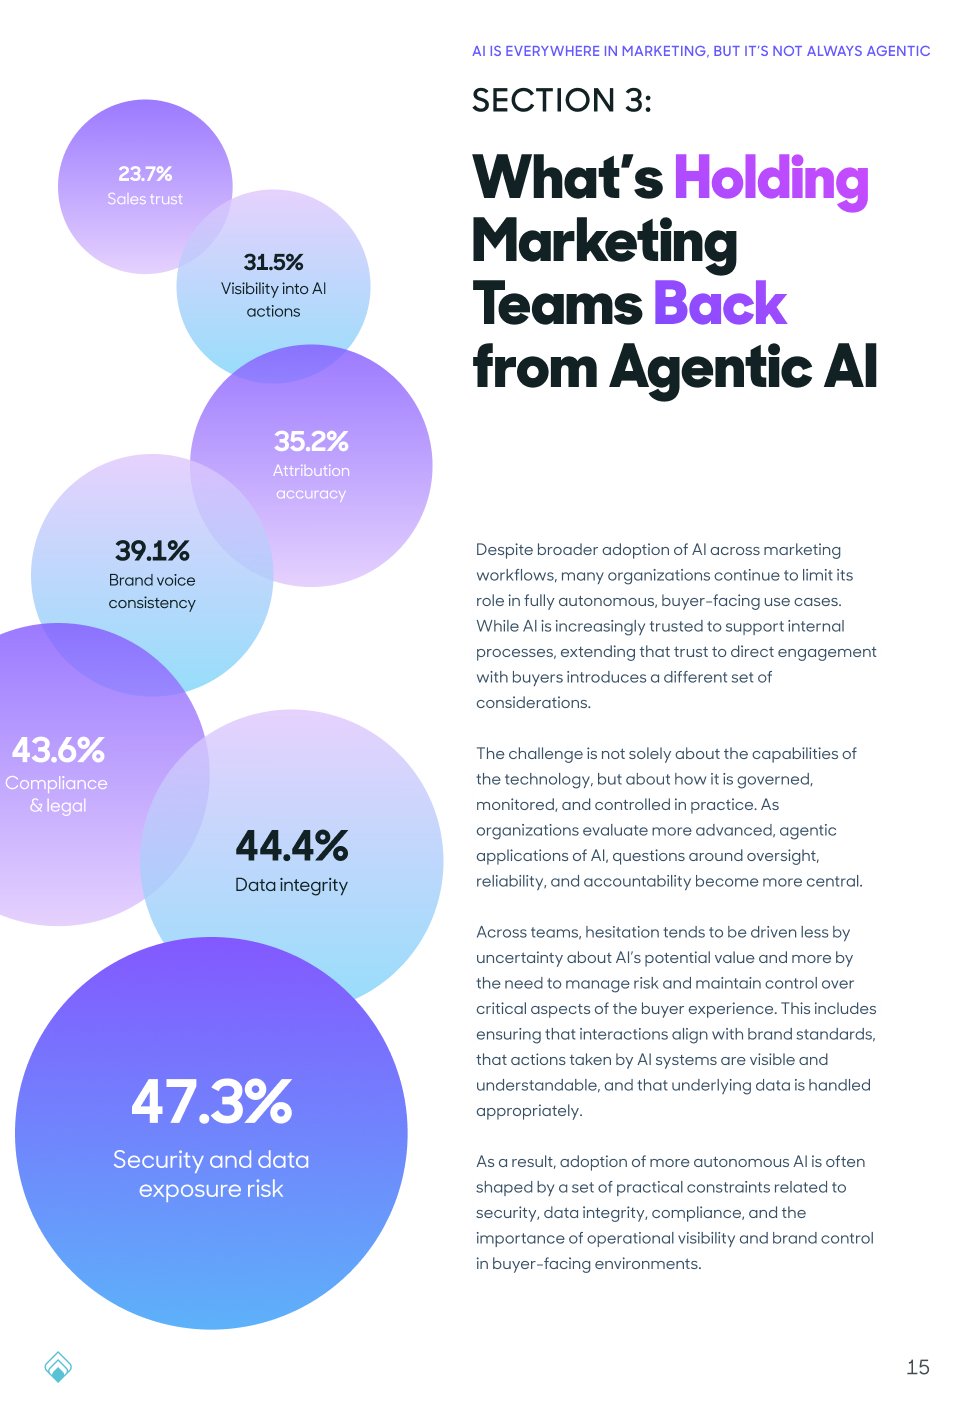


Data visualization played a critical role in translating insights into understanding.
I focused on:
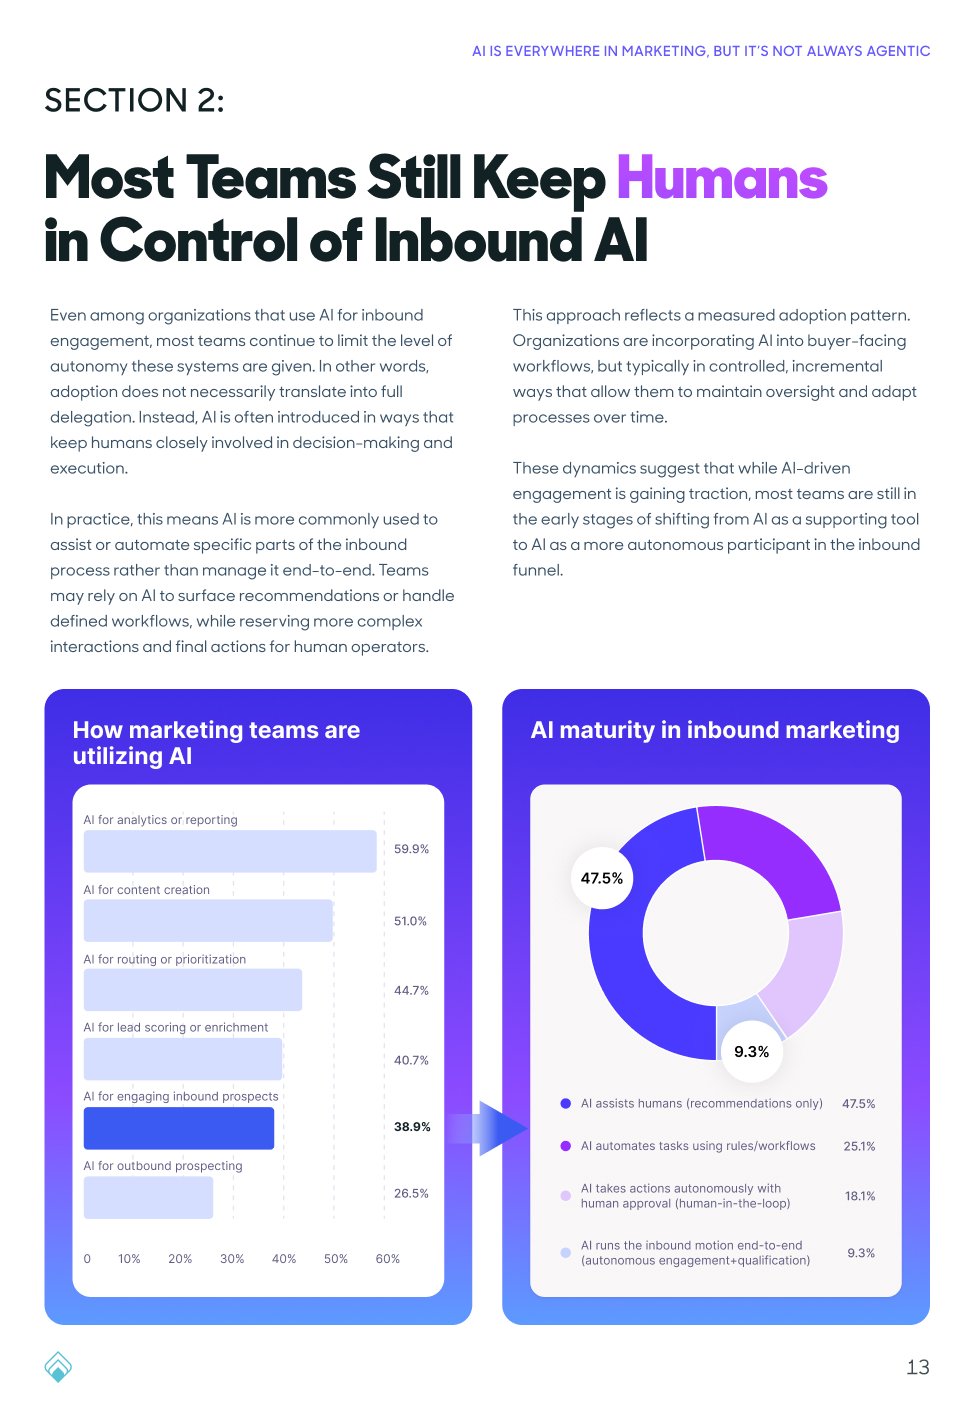
Simplifying complex datasets into clear visual comparisons
Highlighting key deltas (e.g., response rates, pipeline impact)
Using visual hierarchy to guide attention to the most important metrics
Rather than decorative charts, each visualization was designed to reinforce a specific narrative point.
Landing Page Experience
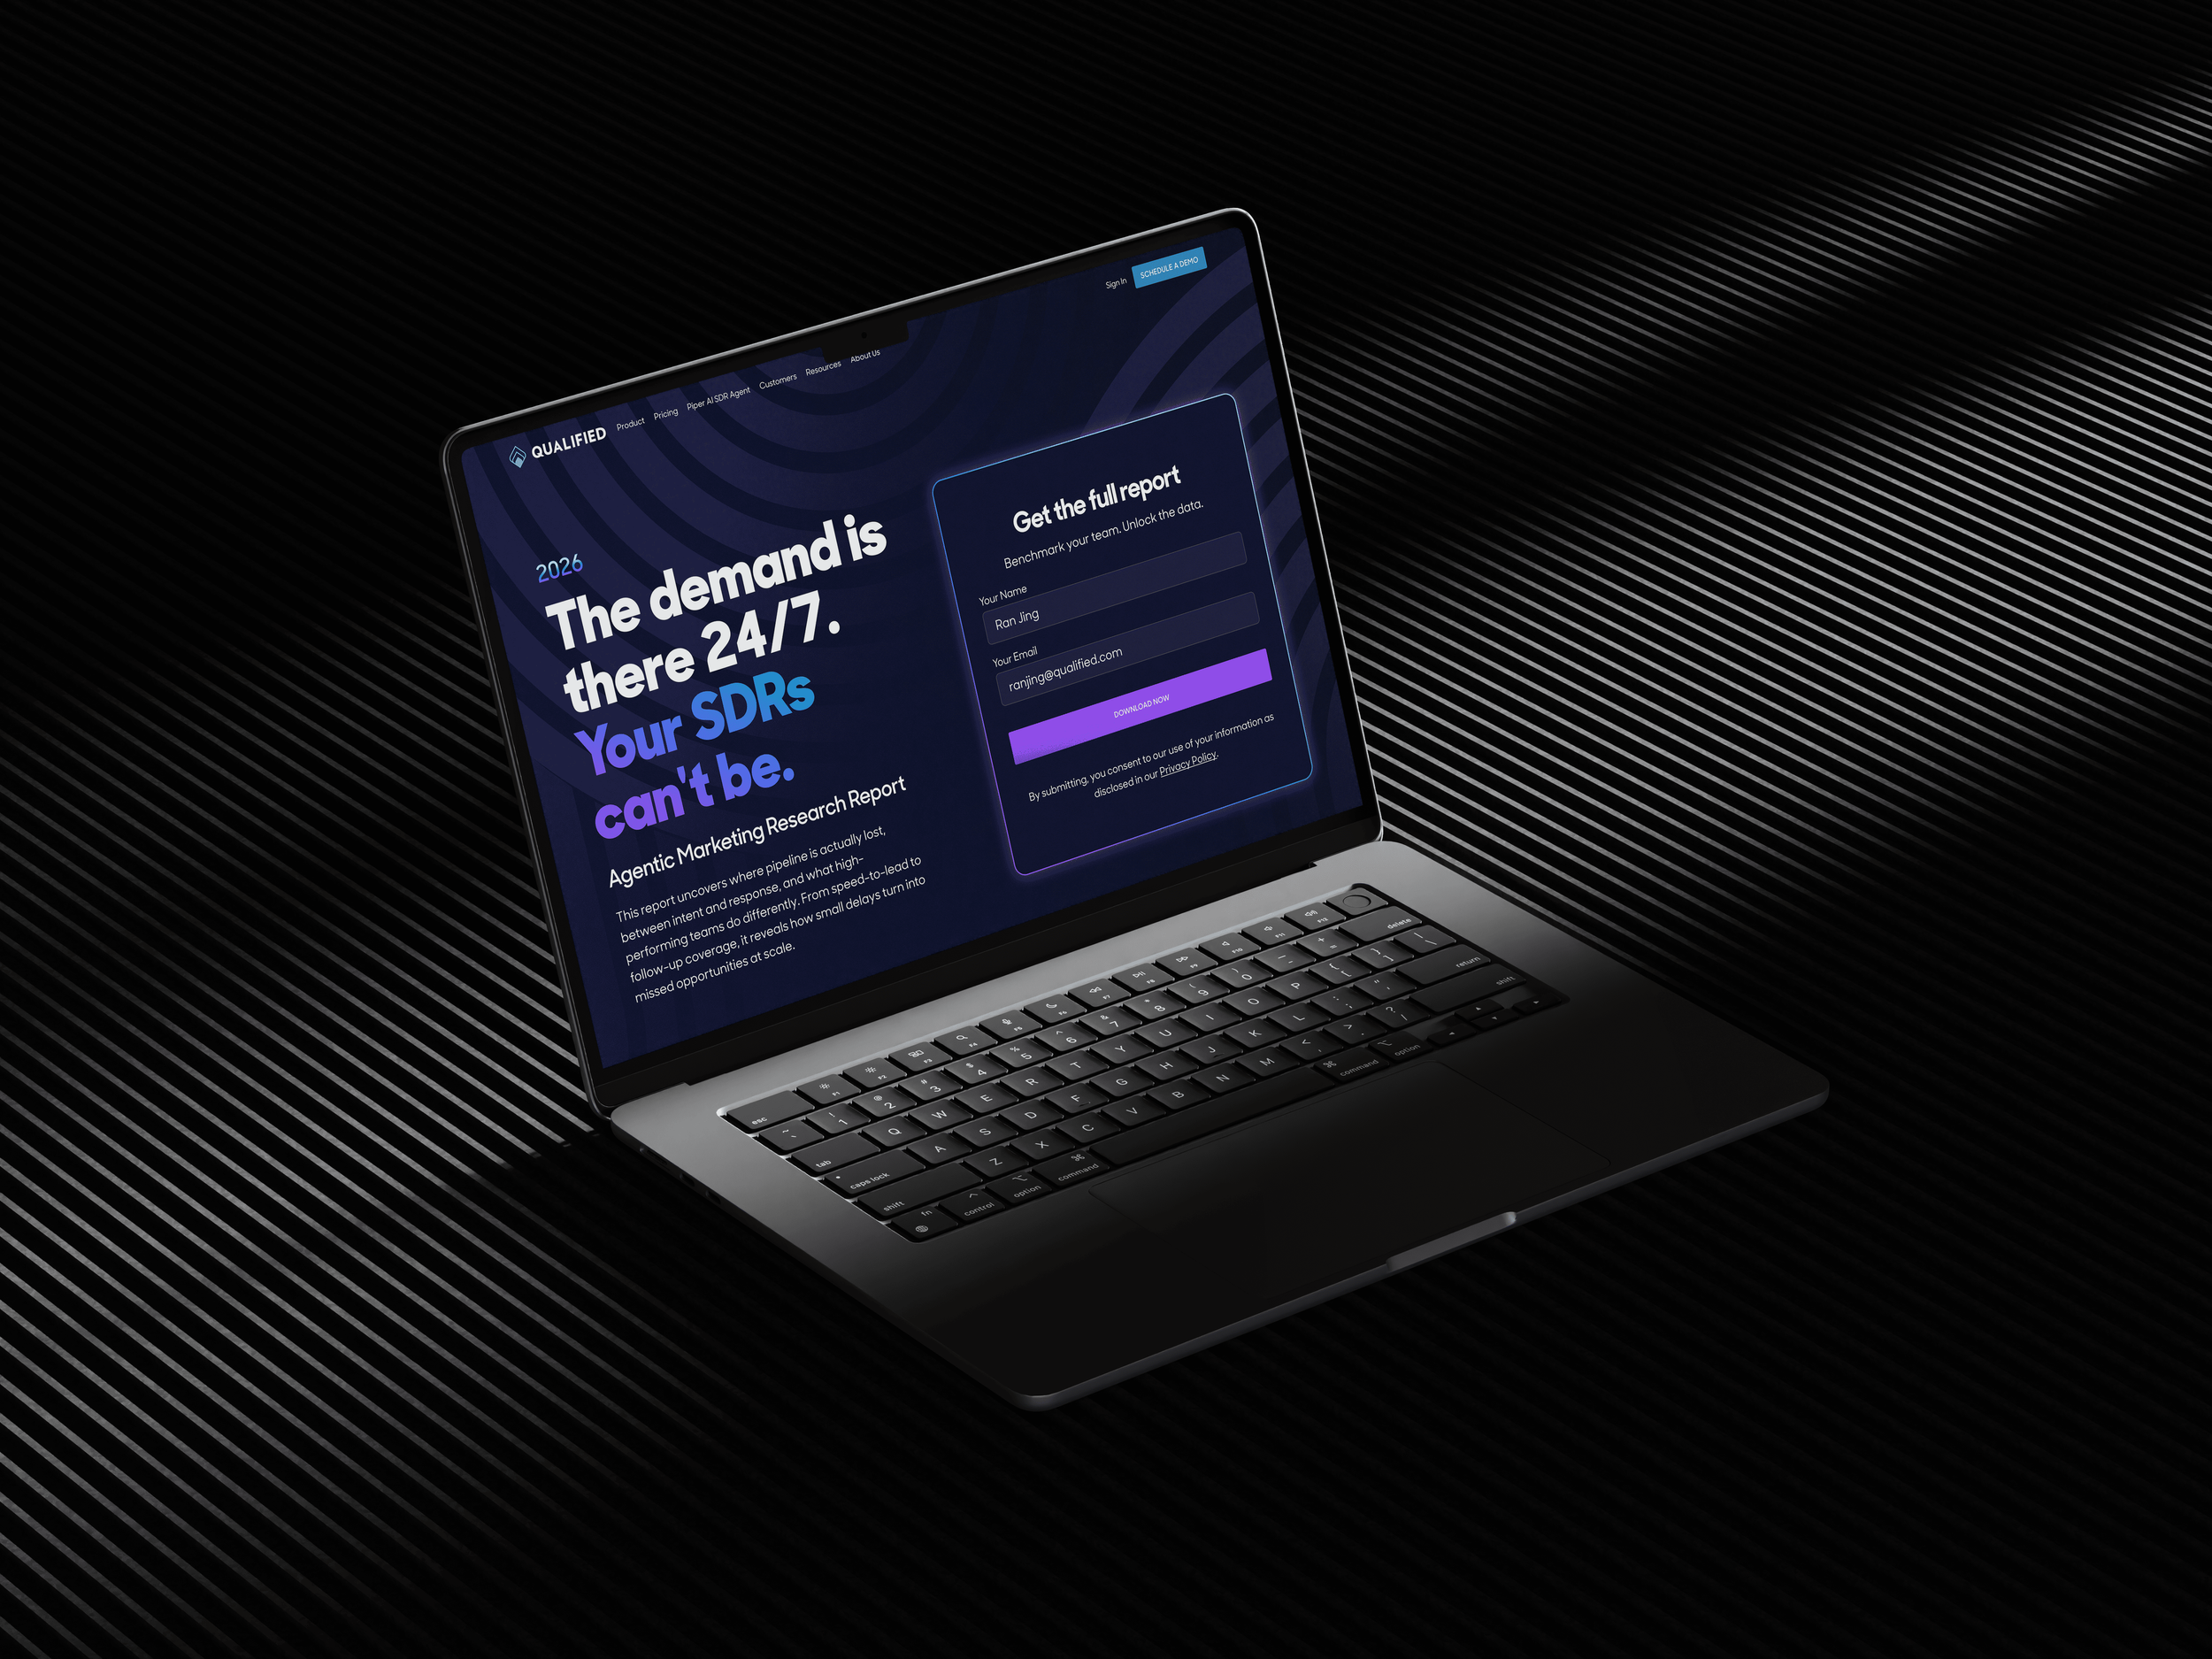
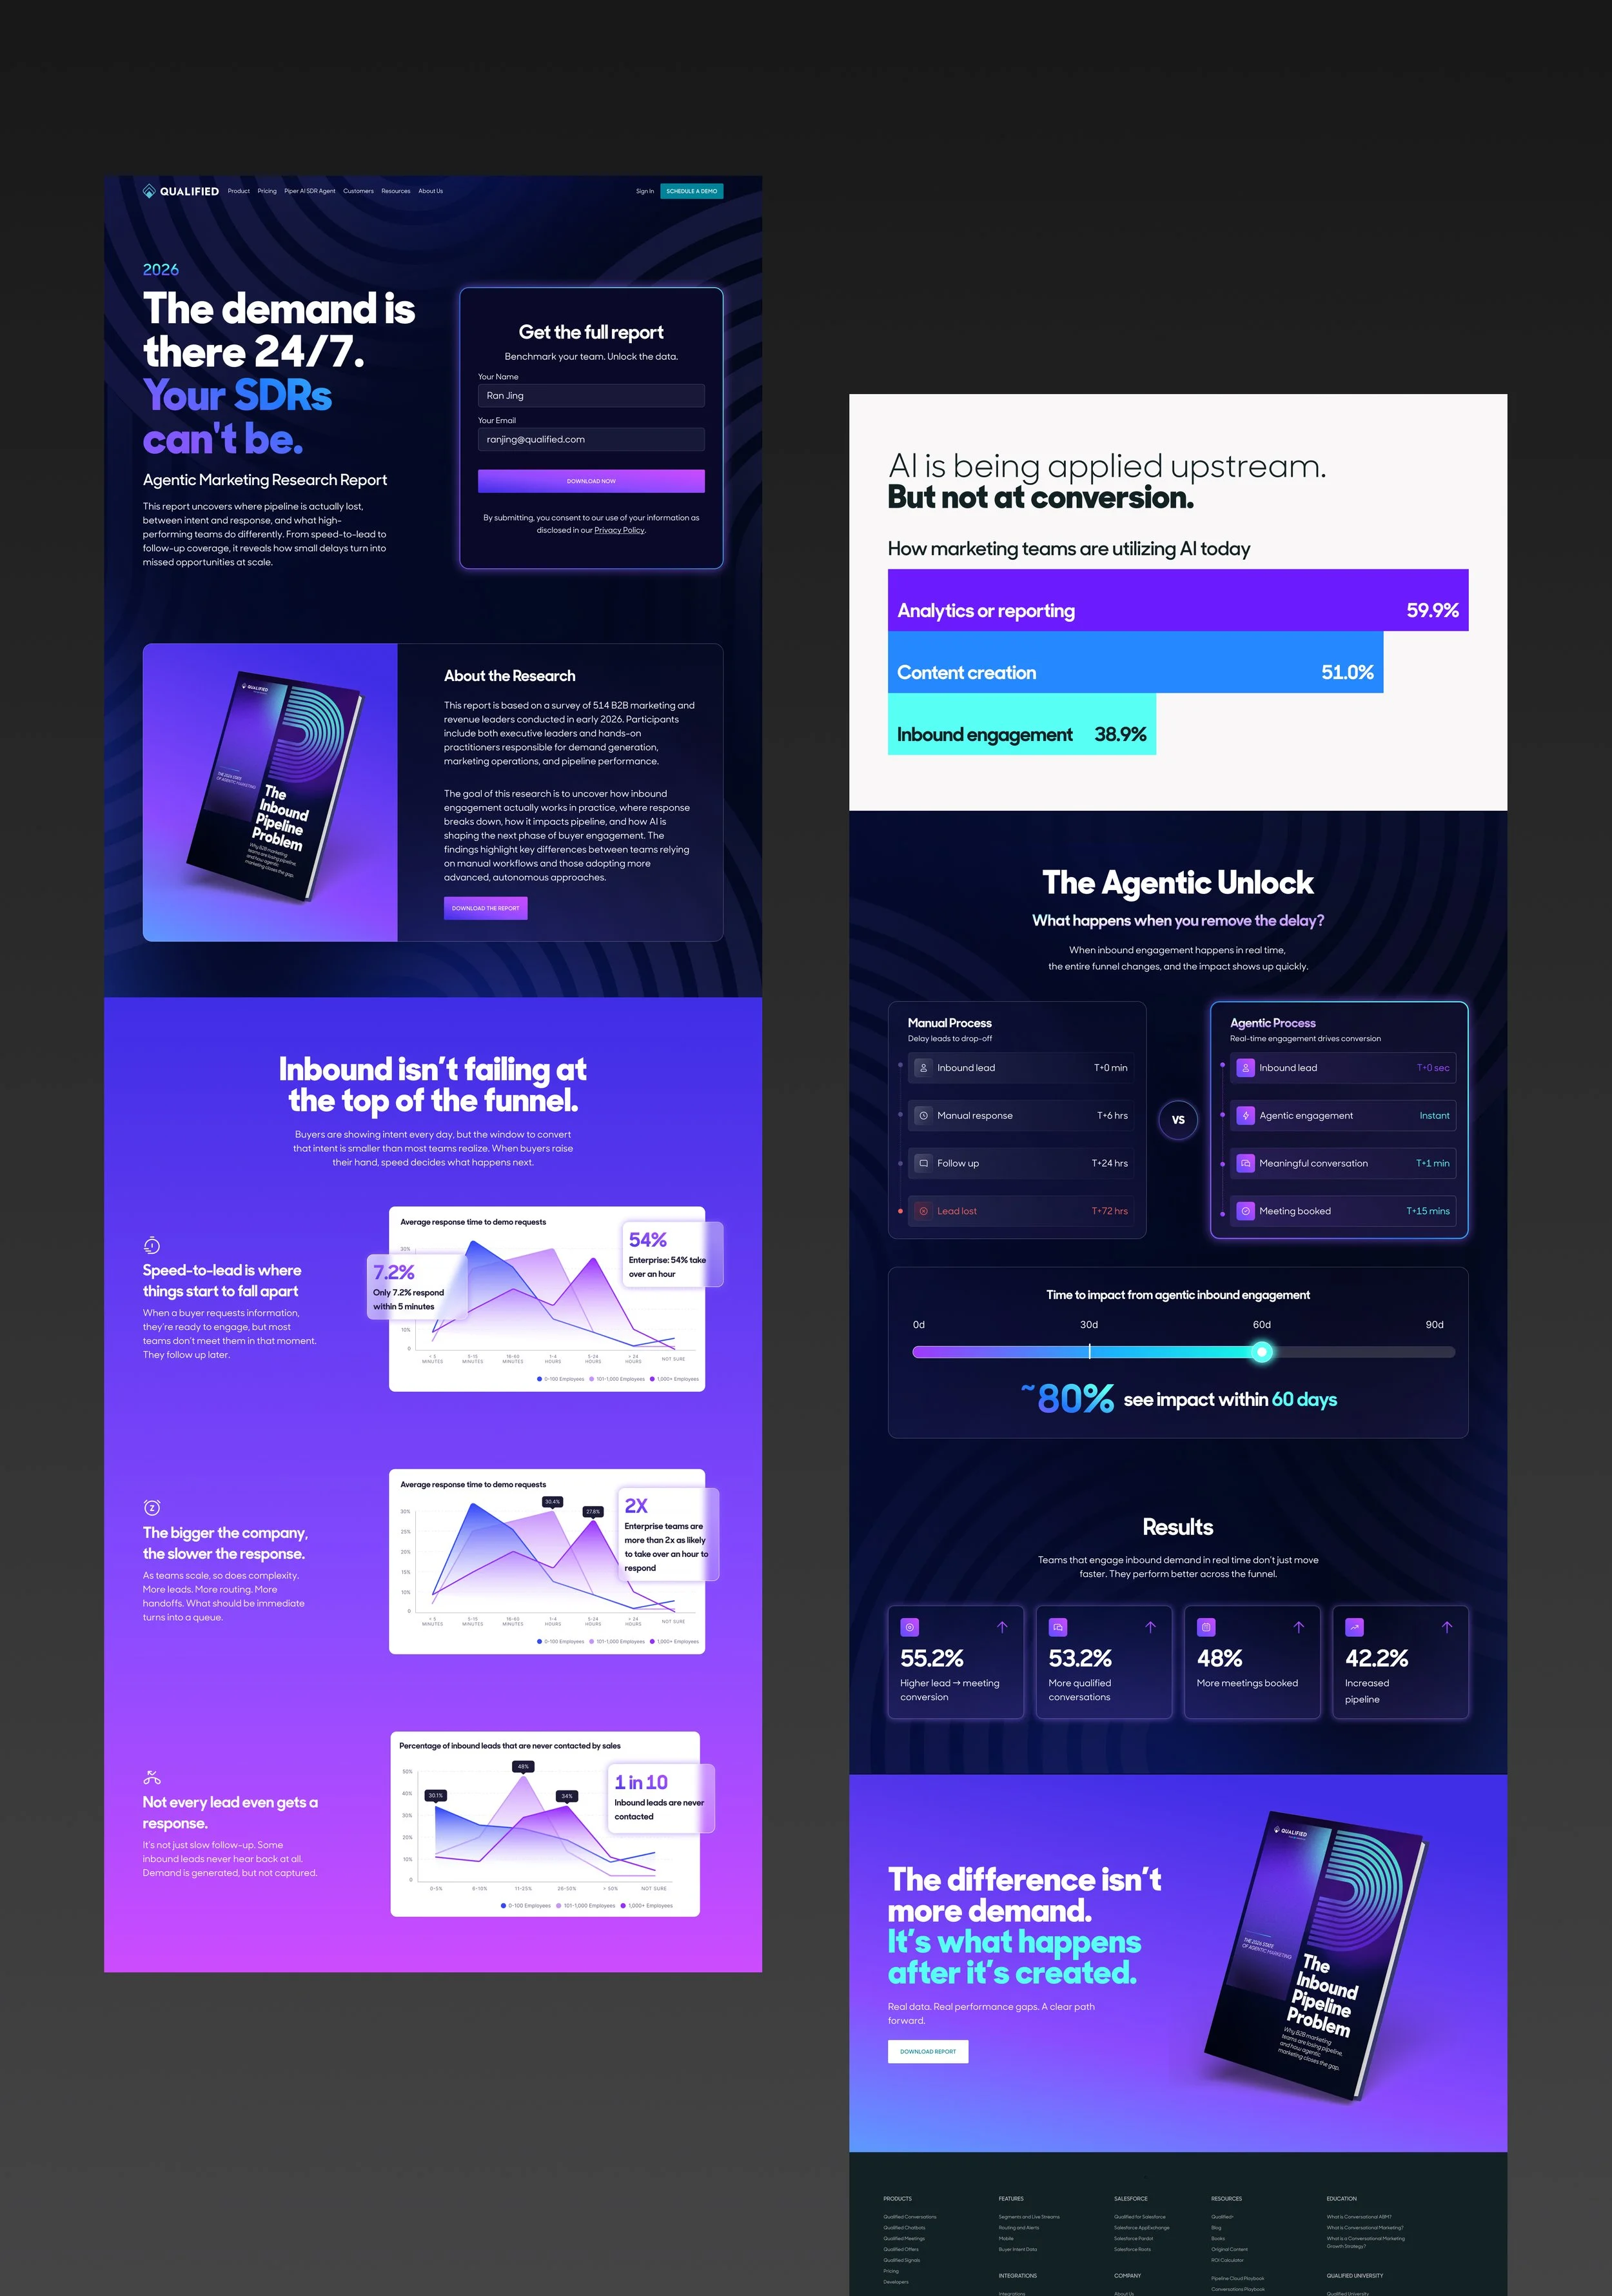
The landing page was designed as an entry point into the report—balancing storytelling with conversion.
Instead of presenting all findings upfront, the page teases key insights while guiding users toward downloading the full report.
Key considerations:
Strong above-the-fold narrative framing
Progressive disclosure of insights
Clear call-to-action with minimal friction
This transforms the page from a static asset into a strategic demand generation tool.
Campaign Email Design
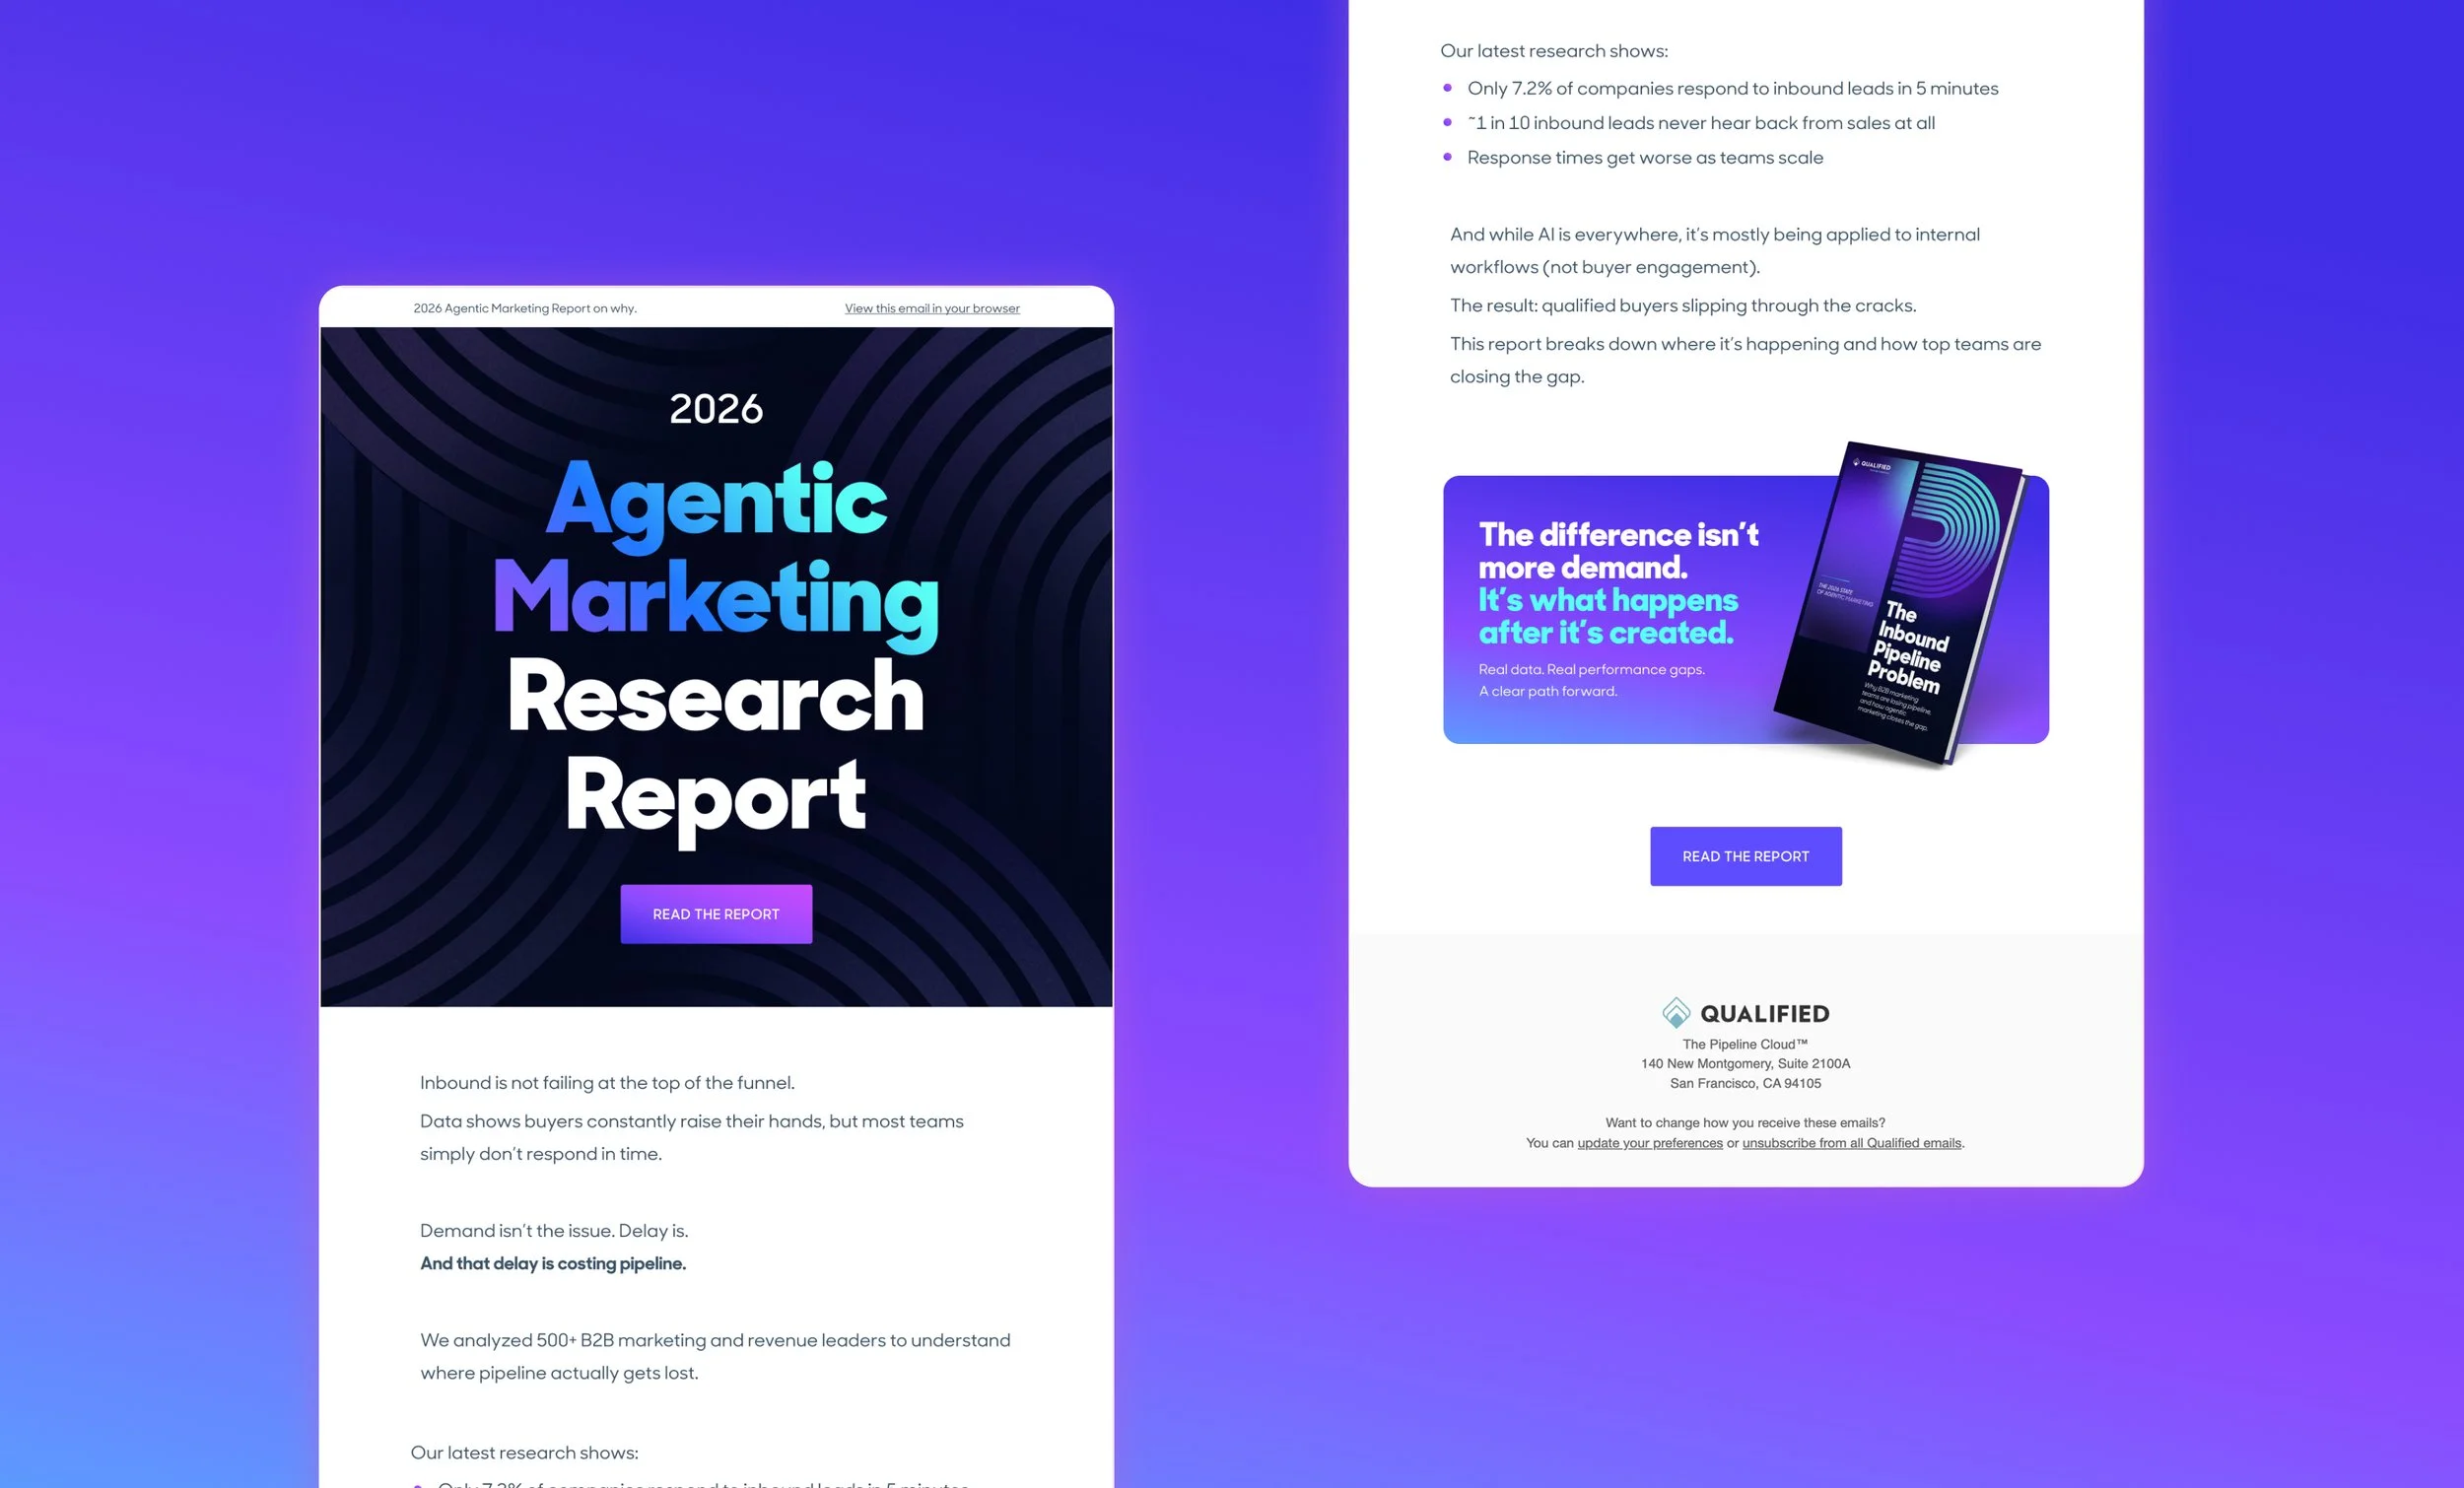
📧 Driving Engagement Through Email
Designed email as a key conversion channel within the campaign—distilling complex insights into a concise, high-impact narrative.
By surfacing a few critical data points, the email creates urgency and curiosity, guiding users from awareness to deeper engagement with the full report.
🎉 Impact
The final experience positions the research not just as content, but as a strategic asset:
Transforms survey data into a clear, persuasive narrative
Helps marketing leaders identify gaps in their funnel
Supports demand generation with data-backed storytelling
Scales across channels as a cohesive campaign system
The project demonstrates how design can bridge data, storytelling, and business impact.